
The S&P 500 is a stock index consisting of 503 stocks listed among the 500 largest capitalization companies traded on U.S. exchanges. Currently, it is a well-known patented trademark of the S&P Dow Jones Indexes.
The listing is typically prepared by the financial market research firm Standard & Poor’s, from which the acronym S&P 500 is derived. It first published the S&P 500 index in 1957. Before its appearance, this organization had launched other types of indices since 1923, for example,S&P 90.
The high demand for S&P 500 securities can be explained by the inclusion of shares of companies from all US economic sectors in the index, with the most objective reflection of the position of various segments. The total market capitalization indicator is above US $32 trillion.
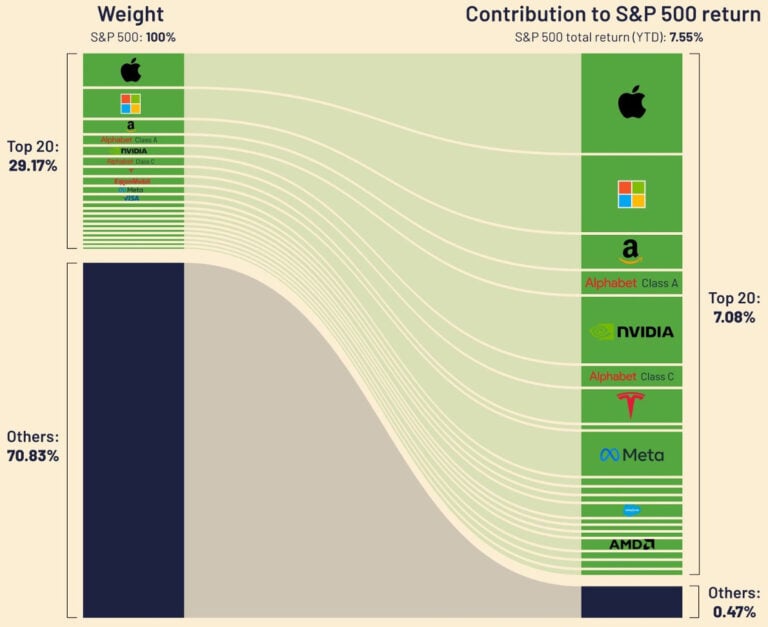
The largest companies determine more than half of the equity value of the index and its performance. The corporations included in the index list differ significantly from each other in terms of capitalization level.
The index value fluctuates constantly throughout the trading day. This is due to regular changes in market indicators of listed companies. Accordingly, a proportional adjustment of the index itself occurs.
List of Standard & Poor’s 500 Index tickers:
- SPXNTR. This type of index is determined depending on the adjustment of tax contributions, payments, dividends, stock prices that relate to investments.
- SPXT. This S&P 500 ticker provides for dividend payments and changes in stock prices. Basically, it takes into account the maximum return an investor can earn from an investment in the S&P 500.
- SPX. This index reflects the total level of capitalization of securities.
Features of calculating the S&P 500 index

The more expensive a company is valued in relation to other corporations and firms included in the index, the more weight it has in it. Calculation operations to determine the capitalization indicator of each individual company are carried out only with share accounting of free-float – shares of free circulation on the trading exchange.
For a company to be eligible to be listed on the S&P 500, it must have a market capitalization of more than US$4 billion.
This calculation is based on the arithmetic average of the weighted market capitalization, which is typical for companies. It is equal to the product of the total indicator of securities and the percentage value of market capitalization.
Calculation of the index indicator (using an example)
Let’s say that the corporation “Bk” issued 1 million securities at a cost of $1 US. The total value in this option is equal to US $1 million. Let’s imagine that the total value of the capitalization of corporations on the S&P 500 list is equal to US $100 million. The share percentage “A” is 1% (or 0.01).
The company “Sp”, for example, has 10 million securities, each of which is quoted at 50 cents. In this case, the contribution of this enterprise to the index will be US $5 million, and the share interest in capitalization will be 5%. In the same way, it is necessary to carry out calculations for other companies.
However, one must take into account the likelihood of changes in all of the above indicators, depending on the adjustment in the value and number of securities.
Composition of companies in the S&P 500
Throughout the year, the list of companies included in the S&P 500 index may change several times. Moreover, all proposed adjustments must be announced in advance, at least two days before their effect.
The S&P 500 list typically includes the 500 largest companies. At the same time, there are no strict restrictive conditions and, as a rule, this list consists of a larger number of them. They are represented by the wealthiest corporations that trade on America’s main stock exchanges.
However, this index should not be interpreted as a listing of the most liquid US companies. It often includes private firms with low levels of liquidity. In this case, a minimum volume of trading transactions is required in the amount of at least US $250 thousand in 30 days.
In addition, Standard & Poor’s, which handles the listing, strives to maintain a broad diversity of areas. As a result, companies from the majority of represented segments with a probability of entering the index in the finishing positions often give up these places to companies that belong to less represented areas, even with minimal market liquidity.
For firms and corporations to be included in the S&P 500 listing, the following conditions must be met:
- Securities must be listed on NASDAQ or NYSE.
- The firm’s market capitalization must be at least US $6.5 billion.
- Based on the volume of trade transactions carried out per month, the minimum liquidity threshold is determined. For 6 months before the valuation date, he must be at 250,000 shares per month.
- At least 50% of securities must be in free float.
- The total amount of corporate profit for the last 4 reporting quarters should not be negative.
- The specific share contribution of the company to the total weight of the index segment is taken into account.
- At least six months must pass after the date of the first placement of the company’s securities on a trading exchange.
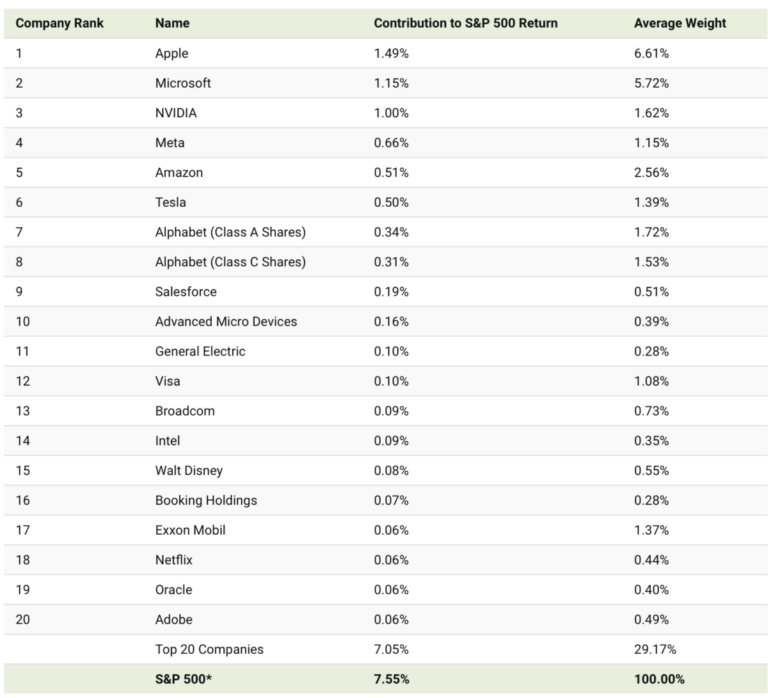
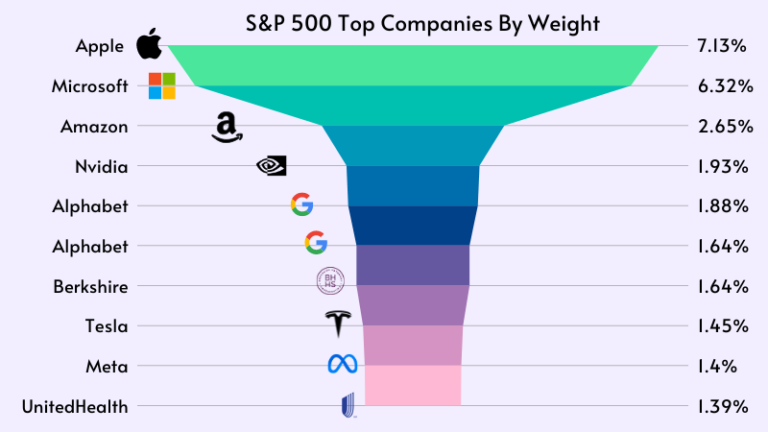
The following 10 companies currently account for 26% of the S&P 500 capitalization:
- AAPL (Apple Inc.) is the largest holding company specializing in the development of digital and software content, as well as technical devices.
- MSFT (Microsoft Corporation) is a global leader in the field of IT technologies with a wide range of services and the development of computer devices.
- AMZN (Amazon.com Inc.) is the world’s largest online e-commerce platform.
- GOOGL (Alphabet Inc.) is a holding company providing software application services, advertising, web search and mobile operating systems.
- JNJ (Johnson & Johnson) is a corporation of 250 subsidiaries producing medical equipment and drugs.
- BRKb (Berkshire Hathaway) is the largest American organization providing services as a management company at many enterprises and firms in various sectors of the economy.
- V (Visa Inc.) is an international digital payment company serving a variety of economic entities – public and private.
- PG (Procter & Gamble Company) is a corporation producing and selling a wide range of consumer products.
- JPM (JPMorgan Chase & Co) is the largest transnational international bank headquartered in the USA.
- NVDA (NVIDIA Corporation) is a company that develops chip systems and graphics processors for use in video games or visualization.
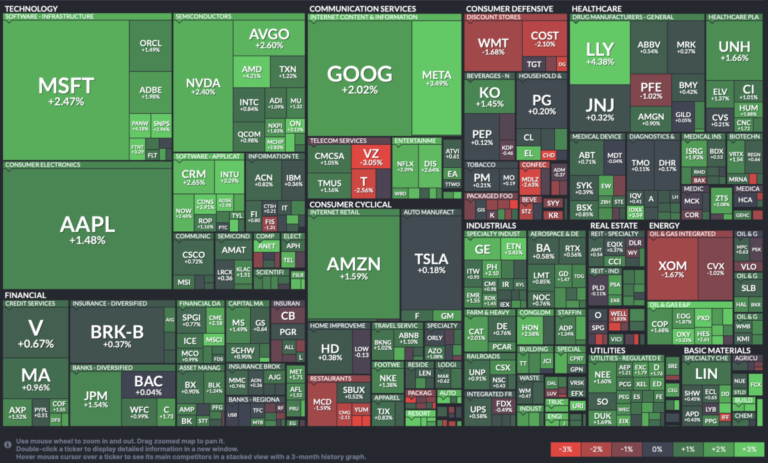
Today, the share of companies in the S&P 500 index is distributed by segment as follows:
- IT technologies – 27.62%.
- Healthcare – 14.31%.
- Goods belonging to the 2nd necessity category – 11.29%.
- Communication services – 11.23%.
- Finance sector – 9.93%.
- Industrial sector – 7.69%.
- Goods classified as 1st necessity – 6.98%.
- Utilities sector – 3.05%.
- Real estate – 2.78%.
- Oil and gas sector – 2.59%.
- Commodity sector – 2.53%.
IT industry companies occupy the first positions in the listing with the highest capitalization indicator. Moreover, for the United States this situation is considered customary.
The financial segment, which has always dominated this list, has shifted significantly downward due to recent crisis situations. The percentage of capitalization of corporations in the field of investments and banking organizations has noticeably decreased.
It is worth noting that the communications and engineering segments are well represented in this list, despite the fact that their 50 ranking does not include such large holdings as Lockheed Martin, Ford Motor and General Motors.
At the same time, a tendency is often observed when a large number of investors, including fund managers, are not able to achieve the level of average annual profitability of the S&P 500 index over a long period of time.
For this reason, experts recommend that investors buy not individual securities, but the entire index. This can be done through ETFs or futures – instruments with which investors can simultaneously invest in several different assets.
How to buy the S&P 500 for your investment portfolio?
It is impossible to buy the index itself, since it is presented as a digital parameter. This index is used to analyze the US market as an indicator of the state of the economy. For traders and investors, there are specific underlying functional tools that correlate with the S&P 500.

For example, there is the possibility of generating income through the use of futures and options. Futures for the S&P 500 have been the underlying capital since the 1980s on the Chicago Board of Trade. They are represented by the following main options:
- MES – the contract volume is several times lower in contrast to mini-futures.
- ES – the volume is one fifth of the full contract size.
- SP is a full-fledged contract.
ETF on the target S&P 500 index
There are also certain funds that completely copy the composition of the S&P 500, with identical proportionality of the share of companies from various economic sectors. The most famous of them is theVanguard 500. It appeared on stock exchanges in the 70s.

This fund was founded in the 90s on the NYSE trading floor. It most accurately reflects the dynamics of the S&P 500. In addition to it, funds such as SSO and IVW are very popular on the NYSE platform.
Traders, as a rule, conduct analytics of leading corporations in a dozen separate segments that can seriously affect the value of the S&P 500.
Features of forecasting the S&P 500 index
You need to know that when analyzing an index, there is absolutely no need to analyze each company or corporation separately.
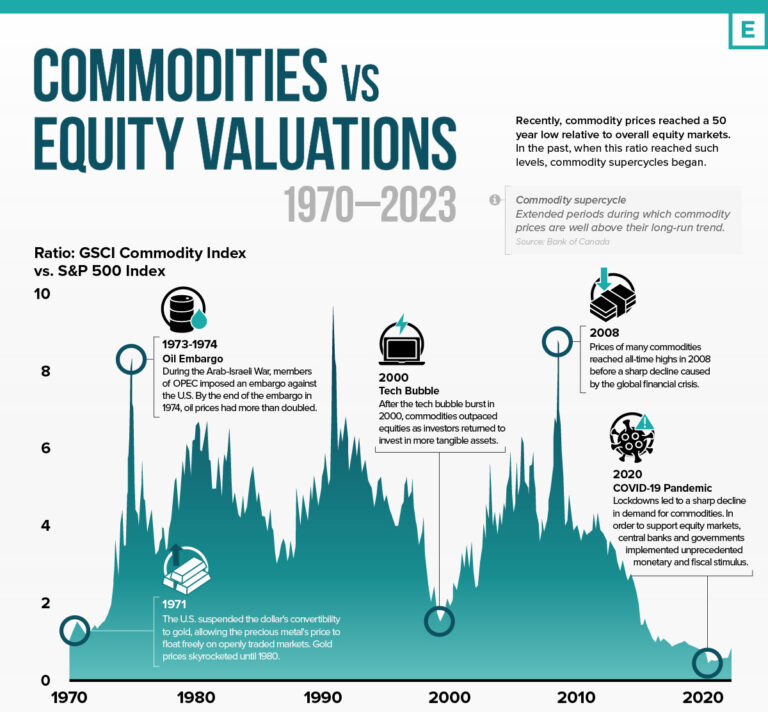
In order to predict the value of the index as accurately as possible, it is necessary to clarify information not only about indicators of supply and demand, production volumes, exports/imports, but also the general situation in the commodity markets, since they can also have a great impact on the price quotes of shares of leading listed companies.
The S&P index shows America’s economic performance, so it is worth considering data on the current economic performance of the United States when conducting your analysis. To do this, you should study the reporting documents of the heads of the Federal Reserve and the Ministry of Finance, as well as review the reports of company leaders.
Key economic indicators affecting S&P 500 index rate quotes:
- GDP is considered one of the most determining values of productivity dynamics in the public economic sector. Data on gross domestic product can be clarified in the quarterly publications of the BEA (Bureau of Economic Analysis).
- Labor Market Data – This data is published every month by the BLS (Bureau of Economic Analysis and Labor Statistics).
- Inflation information – this information can be obtained from BEA (Bureau of Economic Analysis) reports.
- Interest rates – they are controlled by the Fed (Federal Reserve System). It is the central state bank. This information is provided in a special reporting bulletin containing weekly data on different types of interest rates, including mortgages, bonds and loans.
- Information on the foreign trade balance – it is published every month by the U.S. Department of Commerce. This information contains data on trade indicators with different countries, the general foreign trade balance, imports and exports.
In addition to fundamental analysis of the S&P 500, there is a need to conduct technical analysis of it, because the dollar exchange rate directly affects the price of the index.
Many well-known index analysts in most cases recommend using technical analysis. This is especially true for short-term index forecasting.
Interesting facts about the S&P 500
- To this day, the listing includes 86 companies that were included in it in 1957.
- The average listed company capitalization is US $22 billion.
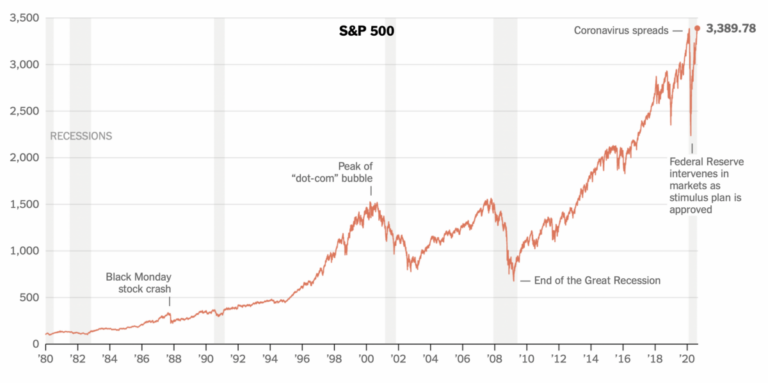
- In April 2021, the historical maximum index indicator was recorded at 4100 points.
- The main competitor of the S&P 500 in terms of popularity is the Dow Jones index (“barometer of the US economy”)
- This index does not include exactly 500 securities. This figure may change due to the inclusion of two classes of shares of the same company in the index and the possible exclusion of companies.
- When the index was founded, its list included shares of companies in only three economic sectors – railway, utilities and industrial.
The key advantage of the S&P 500 index is its optimal diversification and maximum coverage of different areas of the US economy. However, it must be taken into account that the majority of the value of this index comes from approximately 45 well-known global companies.

S&P 500 Index – the best option for beginners
Every new trader who has not previously traded on the stock exchange professionally, as a rule, tries to find the most profitable instrument for safe investment.
To obtain maximum profits and eliminate the risk of financial loss, it is worth regularly researching the stock market and maintaining your investment portfolio.
This requires a lot of time and effort. In addition, you should have at least the slightest skills in this discipline. However, not everyone has the desire and capabilities for this. In this case, it is preferable to use an instrument such as the S&P 500 stock index.
This is an excellent option for getting a quick idea of the profitability of US businesses, without the need to delve into the details of the activities of each company listed in the index. There is also the possibility of making a decent profit over time from your work portfolio without putting in much effort.
Investing in the S&P 500 Index is the most popular strategic decision for the long-term investor. At the same time, you should not try to beat the market; it is preferable to keep up with it.